Pages

Wednesday, November 28, 2012

Taxation with Representation

Instead of “taxation with representation” we have gradually made a transition to “taxation with titular representation.” Representatives are elected in Congressional districts and in States and, in a formal, titular way, they represent the public residing in those geographical regions.

The problem is that getting elected requires an enormous amount of money. I know that’s true because a member of our family ran for Congress a few years back and I have personal experience to back up what is commonly repeated in the media and backed by published statistics. After a person is elected, especially to the House, where the term is a mere two years, the need to raise new funds, for the next election, begins almost at once. Under such circumstances, the tendency is very strong for the legislator to “represent” the biggest sources of his or her funding rather than the masses who contribute very little. Who pays the piper calls the tune.

Okay. This is rocket science. It’s difficult because we cannot see, touch, feel, and taste motivation. We have to infer it. We don’t have time to shadow the legislator’s every move and record his/her every statement, read every piece of paper he/she sees. But if money matters a whole lot, those who have the most should be harvesting the biggest benefits from legislation.

I show a chart taken from a Congressional Research Service (CRS) report that issued this September (link).† Understanding that graphic is not rocket science, however.


Nothing on LaMarotte should be read as advocacy. I’m personally sure that the state of a society always mirrors the state of the individuals in it. No mechanical fixes, reforms, stratagems, or devices (like public funding of elections) change things. Societies are too vast and complex to be ruled by anything other than inspiration—meaning the deepest convictions that move the most people. When things have come to this state, very serious troubles loom ahead. They will eventually produce vast public trauma. And that trauma will, in turn, erase our democratic institutions except (that word again) in titular form. Will oligarchies rule us forever? No. This sort of thing eventually produces a kind of dictatorship but under exalted names—and the ruler will be the enemy of the oligarchy. That’s the way we’re going. Advocacy, no. But I like to know what lies ahead.
---------------
† Thomas L. Hungerford, Congressional Research Service, Taxes and the Economy: An Economic Analysis of the top Tax Rates Since 1945, September 14, 2012.

Saturday, November 24, 2012

The City Proper

That phrase means an urban political unit without its suburbs. Wikipedia has a list of the world’s top 65 of these (link). So why am I here today? Has yesterday’s list-making of world GDPs addicted me? Not really. We saw an old Spielberg film (1987) titled Empire of the Sun. It begins in Shanghai with a British family living in great splendor in a British neighborhood there—while Daddy worked downtown in a setting that, if you only had photographs of buildings, you’d take to be somewhere in Europe. That got me thinking about Shanghai—which so happens to be the world’s larges “city proper” with a population of 17.8 million people.

Shanghai is where Asia’s longest and the world’s third longest river, the Yangtze, enters the East China Sea. The British presence there in the late 1930s during the Japanese invasion of China—which the film was about—began with a similar invasion by the British during the Opium War (1839-1842). That incursion, and the weakness of the Chinese state, led to at least coastal exploitations of China for trade by European and American companies. All that ended when the rightly-named People’s Liberation Army took Shanghai in 1949. That, in turn, led to the wholesale migration of Europeans to Hong Kong (7.1 million), a city that ranks 26th on Wikipedia’s list.

The countries with the largest number of major cities? China ranks first. It has 11. Six of them are larger than our own New York (8.2 million), which ranks 19th, and the remaining five are all larger than our second and last city on the list, Los Angeles (3.8 million). India has 10, three larger than New York, eight larger than Los Angeles. The biggest is Mumbai (Bombay), with 12.5 million and ranked 4th over all. South Africa has three; of those Johannesburg (3.9 million) is larger than Los Angeles.

In addition to the United States, eight other countries are represented by two cities each: Brazil, Egypt, Pakistan, Russia, Turkey, Saudi Arabia, South Korea, and Vietnam.

All told, the list of the top 65 represent 34 countries. Yesterday I spoke of 175 total that reported GDP for 2011—but the full list was 214.

Now as for the film, it is very long (two hours and 32 minutes). It is a little too much like real life and therefore cannot be classed as “entertainment.” But well worth seeing. The world as it is…
———————————
The image is the Great Seal of Shanghai courtesy of University of Florida. The image is copyrighted; I reproduce it with purchase and permission.

Friday, November 23, 2012

World GDP Performance in 2011

According to a World Bank tabulation (link), of 175 countries for which 2011 results were available, 14 (8%) had negative GDP growth, 33 (18.9%) had anemic growth under 2 percent, and 128 (73.1%) had growth greater than 2 percent and up to a maximum  of 20.7 percent.

So where does the United States fall—and who is the winner? Well, the United States had an annual GDP growth of 1.7 percent in 2011; therefore we fell into the anemic category. The best performer in that category was Belgium (1.92%), the worst was the United Kingdom (0.65%). This category also held such eminent names as Australia, Denmark, France, Hungary, Italy, Luxembourg, Norway, and Spain.

The biggest loser in the negative growth category was Yemen (-10.48%), the best performing was Croatia (-0.04%), and the category included Greece, Ireland, and Japan.

And the winner among the strongly growing categories was—Macau SAR: 20.7 percent. So where and what is that realm? It is a part of China. The SAR stands for Special Administrative Region. Macao is one of two, the other is Hong Kong (growth in 2011 of 5.16%). Macau consists of three parts, a peninsula and two islands, all connected by big bridges; Macau is, in effect, invisible when you look at a map of China. It juts into the South China Sea, a close south-eastern neighbor of Hong Kong.

So who was second in the race? Qatar (18.8%). And third? Mongolia (17.3%). Do you feel “left behind?” And does the great British Empire, of which we once were a part, seem to be sinking as the water table rises with the spread of global, ah, warming? Or did I just pick a bad year?
---------------
Map credit: Wikipeadia (link).

Thursday, November 22, 2012

BF In Red


The plastic bag in which, this morning, the Detroit News reached my door. Amusingly Black Friday is rendered in red. And the sale begins at midnight this day at Kohl’s. It was a very thick bundle because every merchant wants a little sliver of this bonanza of a day. I separated the readable from the rest, which, in our household, is transferred straight into a Kroger paper shopping bag unseen. For recycling. What remained was 1-1/2 inches, the advertising material was 5 inches thick. Kohl’s, I am told, has pretty good prices, by the way, had such even before launching Operation: Black Friday. But rendering that name in red may be, for this merchant, courting disaster. What if you stay? In the red.

In a way this reminds me of the Greek who said, “All Greeks are liars.”

Wednesday, November 21, 2012

What Makes Black Friday Black?

As soon as I knew, I wondered why I’d been so stupid. That color comes from accounting. While your enterprise is loosing money, you’re in the red. On the Friday after Thanksgiving, you catch up, you’re in the black.

Black Friday ranks among the top ten shopping days of the year. Most of these fall into December, and traditionally the Saturday preceding Christmas ranks first. In the 1992-2002 period, Black Friday ranked low. In 2003 it was first, again in 2005. Thereafter we have no published numbers. Historical data come from International Council of Shopping Centers.

The Bureau of the Census reports retail data on a monthly basis but lags reality by several months. Last year I noted Black Friday by showing monthly retail sales, particularly for General Merchandise Stores—those most affected by the season; here two links (one, two). Today I update one of those charts, and it follows:


What this shows us is that retail sales in this category in 2011 were higher than the year before—but not by much. Indeed, the percentage increase October to November, which had been 19 percent in 1992, 17 percent in 2002, and 13 percent in 2010 has dropped to 12 percent in 2011. On this graphic I also show sales for the category in 2012—but we only have three months of data, showing how far back reporting lags. Those values indicate that 2012 should be a better year all around.

Now back to Black Friday. What we know about that day is that—if memory serves—it became generally known, by name, no more than five or six years ago. Until then the term was insider talk indicating that profitability is near or here. Since then it has become “an Event.” The media that reach me—and my e-mail—nearly bristle with news of salvation by Mega Savings. And then there is Cyber Monday, and on and on. I feel for these fellows.

In discovering all of the above, I also chanced across another name for Black Friday. It is called Buy Nothing Day (BND) and originated in Mexico in 1992. In 1997 it was then firmly linked to the Friday after Thanksgiving and is observed across the world as a protest against consumerism.

Guess what. I know exactly what to do on BND. I’ll stay at home and make some order in these endlessly growing towers of books.
---------------
The data here are from the Bureau of the Census. Use this link to reach the page from which various reports may be obtained.

Monday, November 19, 2012

SC 24

When in some very distant future the sun goes into nova, it will expand in size. Quite what will happen no one knows. One version of events is that the sun’s expansion will “push” the inner planets “out.” Another is that the sun will “engulf” all of the inner planets, out to the Earth’s orbit, so that we will be inside the sun. We have about 5 billion years to make our plans for escape.

All this, of course, is interesting, but what I would underline here is that we already have our being in the solar environment. As the third planet from the surface, we are quite close to this blazing giant with a mass a million times that of our little sphere of rock.

Back in 1963, at the time of President Kennedy’s assassination—and we do remember, if we’re old enough, what we were doing then—I was reading an article in a magazine suggesting that we were (believe it or not) on the edge of a new period of major global cooling. Yes. And that, in turn, got me interested in ice ages. And in turn then—in the solar cycle. It seemed to me that if the earth either heats or cools, the sun must be causing that change.

The sun has cycles of activity, the recurring solar cycle. It is measured by the appearance of sunspots. Their average number per month has been charted carefully since 1749 and they form peaks (lots of spots) and troughs (few or none). Each cycle is measured from trough to trough; cycles average about 11 years. Astronomers began to number them in the eighteenth century. The first sun cycle (SC 1) was the one extending from 1755 to 1766. We are now in SC 24. It began on January 4, 2008, when astronomers noted the appearance of a sunspot, high on the sun, with reversed polarity. Both are necessary to signal the change from cycle to cycle—appearance of a sunspot at high latitudes as well as magnetic reversal. Sunspots are magnetic fields and, like all magnets, have a N-S polarity. The spots of a cycle always have the same alignment. When a spot appears high on the sun with reversed polarity, S-N, that signals the start of a new cycle.


SC 24 is now beginning to peak. Above I show an image from NASA (link) of SC 23 and SC 24, the latter as far as it has gone. In an article that appeared in March 29 (link), NASA predicted that SC 24 will be “weak,” producing about 90 sunspots at its peak, the lowest observed since 1928. This follows SC 23 which had an unusually enduring and inactive trough. What this might mean is that the sun is going into a cooler period—and that, at least based on common-sense logic, should also mean that the Earth will echo that back. Is such speculation heterodox?

Well, let’s just see. Precise measurement of cycles began in 1749, but pretty good measurements go much farther back. And looking back, we see earlier periods of very low solar activity. The most pronounced of these was the Maunder Minimum, a seventy-year period extending from 1645 to 1715. That period was experienced on Earth, and has been referred to since, as the coldest period of the Little Ice Age, which began earlier. Another, later dip, which lasted 40 years, is known as the Dalton Minimum, 1790-1830. Significant global cooling took place then as well. These two minima are named after astronomers, Edward Maunder (1851-1928) and John Dalton (1766-1844). Measurement during the Maunder Minimum, as shown below in little red crosses, was not quite as systematic as it later became, but the extremely low activity of the sun was noted by a handful of expert astronomers at the time, and the Little Ice Age is well documented (see, for instance, The Little Ice Age: How Climate Made History, 1300-1850, by Brian M. Fagan). During the Dalton Minimum, lower-than-average temperatures were noted, and one observatory in Germany, Oberlach Station, observed a 2° C drop in temperature over a twenty-year period. Herewith a look at 400 years of sunspot observations from Wikipedia (link). The colored lines show the sun cycles; the black line is not identified in the source but may be carbon-14 measurements, an indirect indicator of sunspot activity. More on that on Ghulf Genes (link).


The modern scientific consensus rejects the idea that the solar cycle has a direct effect on global temperature. Climate is a massively complex phenomenon, not well understood even today. And the heat-production of the sun at its minimum (in the troughs) is only about 0.1 percent lower then its output at the maximum (in peaks). But then, of course, I wonder why we speak of the Little Ice Age—which had drastic consequences at least as recorded in Europe—and the cooling during the Dalton Minimum. Could the modern consensus have something to do with excessive caution in a day and age when Global Warming is a major socio-political issue? If the experienced global warming is due to what, in the chart above, is labeled the Modern Maximum, i.e., of solar activity, and may be followed by a lessening of solar heat production in due time (a “weak” SC 24 followed by others), let us hope that that period won’t last long either. Cooling periods are much worse for humanity than periodic warmings.

Sunday, November 18, 2012

Gaza in Proportion

In this day of information saturation, you would imagine that easily-obtained numbers, showing the relative might of the Gaza Strip and of the State of Israel would be prominently featured in a box  next to news coverage of the recent re-re-re-re-ignition of the conflict between Israel and the Gaza strip. I touched on this in the last post. Herewith some additional data:

Gaza Strip Compared to Israel


Ratio

Gaza Strip
Israel
Gaza
Israel
Population (mil)
1.657
7.941
1
4.79
Per capita GDP ($)
3,100
31,467
1
10.15
Area (sq. miles)
139
8,019
1
57.69
Population per sq. mile
11,921
990
1
0.08

The tabulation shows differences between the Gaza Strip and Israel in terms of population, per capita Gross Domestic Product, area, and population density. Nearly 1.7 million people in Gaza occupy a mere 139 square miles, with some 11,900 per square mile. Compared to the inhabitants of Gaza, Israel’s population is ten times richer, has nearly 5 times more people, and nearly 60 times more area. Israel’s density is less than a tenth of Gaza’s.

What follows next is a map of both. Alas, the Gaza strip is virtually invisible. I’ve provided an arrow that points to it.


Now the spectator populations across the world, looking at this, and reading the hyped coverage in the media—where the oppressed and one might say suffocated population of Gaza is the chief villain, might well say, Hmmm…

Friday, November 16, 2012

U.S. Military Aid to Israel

Are we in some way participating, through the taxes that we pay, in the violence centered on Gaza that is now beginning in Israel. Yes, in a way. In the current fiscal year we gave Israel $3.1 billion in military aid; it accounted for 99.4 percent of all aid we gave that country. That’s a fair amount of money, indeed a fifth of Israel’s 2012 expenditures on the military ($15.2 billion), that number from to Wikipedia (link).

I show here a graphic tracking U.S. military aid to Israel for FY 1997 to FY 2013 (the last is proposed) along with bars showing what percentage that aid is of total U.S. aid to Israel. My source is a Congressional Research Service paper dated March 12, 2012 (link).


Two out of every ten bullets or missiles or bombs are ours, you might say. We don’t participate in targeting.

Monday, November 12, 2012

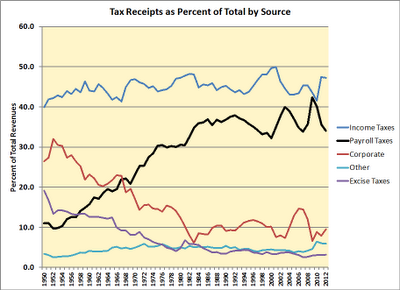
A Look at Payroll Taxes

It’s eye-opening to look at the role that Payroll Taxes have played over time as a source of Federal Revenues. The data are there, to be sure, but not presented quite as starkly as I am doing this morning. I have these data from the Office of Management and Budget, an agency of the White House (link, see Table 2.1).


The dramatic change in the 1950 to 2012 period has been the steep rise of payroll taxes as a percent of total revenue—and the almost parallel decline of corporate taxes. To make this picture even more dramatic, we can look all the way back to 1934 using the White House Data. Here it is in a tabular form.

Revenues as Percent of Total, 1934, 1950, and 2012
Change from
1934
1950
2012
1934
1950
Income Tax
14.2
39.9
47.2
33.0
7.3
Corporate
12.3
26.5
9.6
-2.7
-16.9
Payroll
1.0
11.0
34.1
33.1
23.1
Excise
45.8
19.1
3.2
-42.6
-15.9
Other
26.7
3.4
6.0
-20.7
2.6

Now it is well to keep in mind that payroll taxes are regressive, thus they apply only up to a salary/wage income of $110,100 in 2012 and (perhaps appropriately in year 2013) to $113,700 next year. Thus it does not cover all of the $250,000 which seems, today, to mark the boundary of “real” money. But it falls heavily on the working poor. For them the payroll tax is a real whopper, comparable or greater than owed income tax.

If we now drop down that Fiscal Cliff, that black line up there will shoot a ways higher. The graphic also shows that Social Security contributions loom very large in the eyes of the Federal Government. They represent more than a third of the total revenue stream.

For completeness, the Other category consists of estate and gift taxes (7.7% in 2012), customs and related fees (21%), and miscellaneous income (71.3%). Of that last about three-quarters are interest earnings of the Federal Reserve.

Excise taxes are levied on alcohol, tobacco, telephone services. It also includes windfall profit taxes and revenues associated with transportation and other sectoral activities.

Who has the power? If we look at changes between 1934 and 2012, we see that the lower quintiles of the population have borne the brunt of increases, 33.1 percent; those paying income taxes come next.  Those for whom the payroll tax is a meaningful levy saw it as the biggest tax increase in the 1950 to 2012 period! They bore the brunt of the relatively small increase in income taxes due to the tax-cutting that became a perennial favorite in politics in that later period. My youngest daughter, once long ago, still as a child, articulated the benefits achieved by the corporate and institutional sectors. Asked to share a toy, Michelle memorably said: “I want to share by myself.”

Saturday, November 10, 2012

The Rock and the Hard Place

Tax increases and mandatory program cuts, due to take place January 1, 2013, are the so-called Fiscal Cliff. In its May 2012 report (link), the Congressional Budget Office put the effect of that event—falling off the cliff, thus letting the laws now in place go forward without change—at $559 billion for FY 2013. I’ve cited a slightly lower number in yesterday’s post. This in effect results in a lowering of the total FY 2012 deficit from $1,171 to $612 billion in FY 2013. The CBO then goes on to say that this change will weaken the economy. Therefore unemployment will increase and GDP growth will slow. The logic behind this is that people will have less money to spend. Spending less, the private sector will have less income. It will respond by laying off people. That is the rock.

The hard place is the level of the National Debt.  It has a legally set ceiling of $16,400 billion. According to the Treasury’s website (link), the actual debt was $16,245 as of yesterday . We are going to exceed it fairly soon. The downside of that, nominally, is that U.S. national debt will be down-graded as it reaches ever higher levels of GDP. The current debt, measured against current GDP (for the 3rd Quarter of 2012, annualized) was 102.9 percent and trending up—comparable to China’s at 16.3 percent, and trending down.

This means that if we reduce our deficit, by gladly falling down that fiscal cliff, we shall lose jobs and economic momentum. If we resist going over the cliff, we shall have decent GDP and jobs growth but, by 2016 (the next national elections), our debt to GDP ratio will be 111.9 percent (China’s at 9.7%).

Not quite sure which way I want to jump. What helps, somewhat, is to contemplate 1945. That year our Debt to GDP ration was 134.5 percent—and we survived. To be sure, that was war time. Maybe we are again, at war. In more ways than one. If the GOP has its way, tax cuts will not expire and therefore, in theory at least, people will happily be spending money to whip that sluggish GDP into a faster trot. But to save us from breaking the Debt Ceiling—and again and again—will require very massive program cuts. And what will that mean? Less income for people, actually. Get rid of Social Security, Medicare, Medicaid, Unemployment Insurance, agricultural subsidies, pensions, highway funds, etc. But doesn’t that amount  to the same thing? No money, no spending, no jobs? Surely it does. So it’s a rock and a hard place, whichever way I look.

Related post.

Thursday, November 8, 2012

Abrupt Transition

One day it was all about momentum and battleground states (but like dominoes they fell for Obama), abruptly we are supposed to be terrified—by the Fiscal Cliff. So just what is it—and how big?

This Ogre has four components. Those, and the estimated of the impact of each, are shown in the following tabulation:

Fiscal Cliff Components and impacts, in $ bill.
Bush tax cut roll-back
280
Payroll tax cut roll-backs
125
Emergency unemployment benefit termination
40
Budget Control Act spending cut mandates
98
Total Impact
543
As percent of GDP
3.4

The impact estimates come from the Wall Street Journal (May 16, 2012) citing J.P. Morgan economist Michael Feroli. In current journalistic rounding, I find some putting it at anywhere between $560 to $600 billion. Whatever. The total amounts to 3.4 percent of GDP, and one way to view that is to apply it to one’s own personal income. If that income is, say $45,000, a 3.4 percent cut would translate to about $129 per month. Okay. Ouch. But a fiscal cliff it is not.

Nor is it likely to take place as currently projected. What the abrupt transition from Election Hype to Fiscal Cliff Hype indicates, however, is that the media exist by promoting great clouds of anxiety. We must seamlessly move from one to another. Therefore, predictably…

But as the election itself refreshingly revealed, the people collectively have some sense. I say that after every national election whether the people I supported win or lose. Therefore the Fiscal Cliff will not cause a collective epileptic fit—except among the pundits.

Wednesday, November 7, 2012

Money in Politics

The elections are over. President Obama remains in office. As in earlier years, but more intensely than ever, the media emphasized the power of money, particularly of independent groups, such as political action committees (PACs) active on behalf of candidates but at a distance: the campaigns could not influence them.

The New York Times featured a page (link) yesterday showing total spending by such independent organizations as of November 6, 2012. The listing featured 35 Republican and 10 Democratic groups. I show the results in the following graph:


I look at this and say to myself, “If money could buy elections, the Republicans should have swept the field.”

But the picture is mixed when we include funds actually raised by each campaign combined with funds contributed by the two party committees, the Democratic and Republican National Committees (link). Those in the following tabulation (in millions of dollars):

Funds raised by the candidates
Obama
Romney
Campaign
637.3
388.1
Party Committee
214.6
342.0
Totals
851.9
730.1

Here Obama had more money than Romney, although the difference between them isn’t very large. Money obviously plays its role, but would not seem to be conclusive. What this tells me is that my deeply-held doubts about the predictable powers of advertising need not be reexamined.

Monday, November 5, 2012

Voice Spam

We use a Uniden cordless telephone on two floors. In the basement is a venerable old green telephone of the bygone age. To be sure it has push button dialing, but underneath it says, impressed into the brass plate, “Bell System Property, Not For Sale.” I spend my morning in that basement. And now, now that the season of voice spam is reaching its most hysterical boiling point, I make my coffee in the morning and then stick the cordless Uniden into my shirt pocket. It has a little screen, of course, and when the phone rings I look there to see if a family member, friend, or doctor’s office is on the other end. That helps a little. The current form of my Denial (of everything modern, that is), takes the form of pushing Talk and immediately afterwards pushing End. What the little Uniden lacks is a way of automating answering. I wish I could program it with a handful of numbers—and, at my option—cause it to hang up, automatically, on all the rest, indeed before it permits itself to ring.

A certain cost in time and effort goes into the creation of an automated telephone message. The school board candidate who just called me automatically (sometimes if rarely I do actually answer) probably had to visit a studio, may have paid for parking, spent some time before (writing, honing, practicing his message), recording it, and the listening to the result. He had help, and help must be compensated. Then there is the cost of getting it on the air and programming it to call a set number of numbers—the acquisition of which has a cost as well. Money.

At last the call comes to interrupt me. Such phenomena of disembodied persuasion always make me wonder if anybody is actually moved to any kind of useful action from which the candidate benefits. I doubt it. Faith in the power of advertising, however, is bottomlessly deep. The philosophers who claim that reality is Pure Will can take comfort from such behavior. Money is no object if you believe—believe in the fulfillment of your wish. And those who sell this kind of ethereal Brooklyn bridge at least get paid in real dollars.

Nor can I sanction those who call me—by carefully noting their names and not voting for them because they called. Those I’ve long ago decided to support also call. And even that inconvenience won’t change my mind. In some still extremely dim future, humanity will look back on the Magic those people believed in. And some, in that future, will try to practice it too—only to discover that it doesn’t really work.

Saturday, November 3, 2012

Just a Little Jar of Pickles

Costco style! She Whose Food Must be Tasted is planning something mysterious. It involves masses of pickles. Hence she dispatched me to buy three jars. Looking for these I encountered the gallon-jar of Vlasic Kosher Dill Wholes—and, being at Costco, it was massive. I figured that she would be delighted and settled on buying just one. Well, she was! She wanted a picture of it, presumably for Facebook.


Well, my little Kodak M893IS, whose characteristics are that she is the smallest Kodak, presumably, decided not to be cooperative. She absolutely refused to show just how HUGE this jar really is, despite various efforts on my part to introduce perspective.  Instead, she made it fit her own view of size. Well, it’s the best I can do—but I do include a duette in which that jar is next to a 1/2 gallon bottle of Buttermilk. And I show images with and without a flash.


Costco features industrial-size retailing. If I owned a forklift, I’d take it with me shopping there. You want to see a cucumber that would not fit in this jar? Here it is. I purchased in mid-September from a household in our neighborhood; they were selling the surplus of their garden on the curb. Are we in some ways fixated on cucumbers around here? No. But unusual size does fascinate. A recent fascination is with Shi Tzus—trying to recognize them from a distance. And I do keep hoping that, someday, genetic science will deliver the miniature elephant, the perfect pet, about the size of a goat.

Friday, November 2, 2012

Employment Update: October 2012

The October employment report (Bureau of Labor Statistics, link), the last one before the elections next Tuesday, were quite favorable. First of all, both August and September data were revised, upward, August by 50,000 and September by 33,000, so a gain of 83,000 over the last report. Then, the change from these revised totals in October was an additional increase in employment of 171,000. The chart follows. Revised months are marked in pale red, October results in red.


This month we also, finally, crossed a symbolic border. We have now recovered 51.2 percent of the total jobs lost in the 2008-2009 period. It took almost three years to regain half the jobs lost in two. But the direction is upward, however slowly. I show that result in the next graphic.


These numbers, ultimately, have little to do with who is in the White House or who controls Congress. The Great Recession, however, may be blamed, at least in part, on the Federal Government. It had loosened banking controls gradually and thus “enabled” the mortgage bubble to develop. That disaster did not take place under President Obama, however. But at the level of the Great Collective, which struggles to display even the intelligence of a duck, we operate under odd delusions…